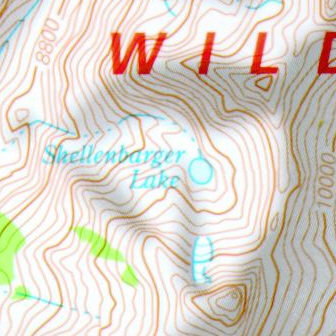
1. First a suitable contour map was found, just like the one above.
|
8625 |
8720 |
9080 |
9504 |
9800 |
9980 |
10160 |
10320 |
10480 |
10880 |
|
8616 |
8840 |
9280 |
9680 |
10160 |
10200 |
10280 |
10440 |
10560 |
10520 |
|
8672 |
8944 |
9376 |
9800 |
10080 |
10256 |
10504 |
10780 |
10600 |
10340 |
|
8840 |
8910 |
9260 |
9496 |
9680 |
9850 |
10240 |
10400 |
10480 |
10160 |
|
8700 |
9088 |
9280 |
9500 |
9660 |
9800 |
10010 |
10216 |
10440 |
10100 |
|
8920 |
9230 |
9640 |
9760 |
9900 |
9880 |
9880 |
10160 |
10440 |
10100 |
|
9200 |
9400 |
9700 |
10010 |
10080 |
10080 |
10070 |
10224 |
10330 |
10000 |
|
9344 |
9640 |
9840 |
10160 |
10440 |
10320 |
10400 |
10440 |
10300 |
10080 |
|
9296 |
9510 |
9800 |
10060 |
10320 |
10680 |
10800 |
10640 |
10300 |
10090 |
|
9384 |
9620 |
9820 |
10060 |
10320 |
10640 |
10800 |
10500 |
10200 |
9980 |
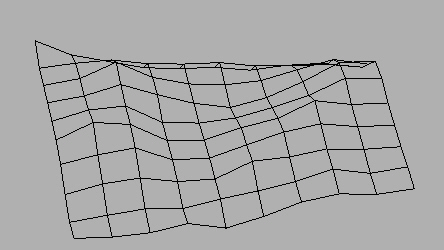
3. A corresponding wireframe model was produced with Java 3D,
hard-coding the altitude values within the program code.
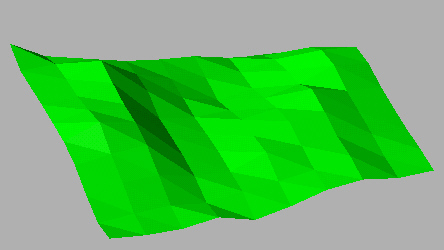
4. A Java class was created for calculating the required geometry
and normals for a flat shaded version of the surface.
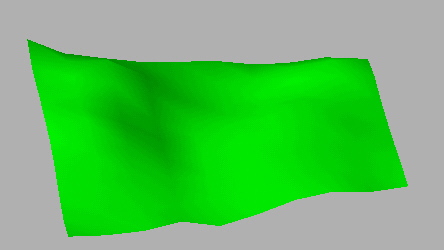
5. An additional Java class was created for calculating the required
geometry and normals for a Gouraud shaded version.
|
100 |
0 |
0 |
0 |
10 |
0 |
0 |
20 |
0 |
0 |
|
0 |
0 |
10 |
10 |
20 |
10 |
10 |
40 |
20 |
0 |
|
0 |
100 |
20 |
20 |
20 |
20 |
20 |
50 |
90 |
20 |
|
0 |
10 |
20 |
50 |
70 |
50 |
40 |
10 |
50 |
0 |
|
10 |
20 |
20 |
70 |
100 |
80 |
20 |
20 |
10 |
0 |
|
0 |
10 |
20 |
50 |
70 |
50 |
20 |
10 |
0 |
0 |
|
0 |
10 |
20 |
20 |
50 |
20 |
20 |
10 |
0 |
0 |
|
80 |
0 |
10 |
10 |
20 |
10 |
10 |
0 |
50 |
0 |
|
100 |
0 |
0 |
0 |
10 |
0 |
0 |
10 |
100 |
10 |
|
50 |
0 |
0 |
0 |
0 |
0 |
0 |
0 |
0 |
50 |
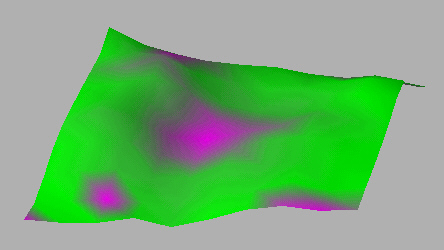
7. The previous Java class was extended to produce a colour mapping,
to present the above data about the plant populations across the surface.
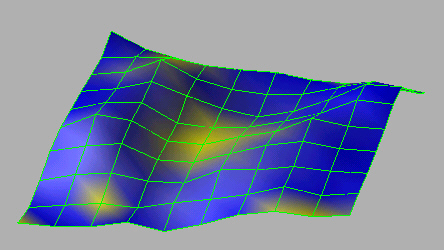
8. Finally a different colour scheme was used with also a nice bright wireframe
overlay. Notice that the shininess has been slightly increased as well.